Tag: David Peetz

  • The Flawed Economics of Cutting Penalty Rates

    The Flawed Economics of Cutting Penalty Rates

    by Jim Stanford

    It was a “sleeper” issue in the recent election, and led to the defeat of some high-profile Liberal candidates.  But now the debate over penalty rates for work on weekends and public holidays shifts to the Fair Work Commission.  The economic arguments in favour of cutting penalties (as advocated by lobbyists for the retail and hospitality sectors) are deeply flawed.

    Penalty rates for working on weekends were an important “sleeper” issue in the recent federal election.  On the surface, both Labor and the Coalition agreed the future of penalty rates would be determined by the Fair Work Commission.  But that superficial consensus couldn’t hide deep differences in what the respective parties were actually hoping for.  Labor explicitly urged the FWC to maintain existing penalties: double-time on Sundays, and time-and-a-half for Saturdays.  Many Coalition candidates, on the other hand, endorsed a reduction in penalties – consistent with the views of business lobbyists who want lower operating costs on weekends.

    At the grass-roots level, meanwhile, the issue resonated strongly with significant numbers of voters.  Union activists launched an 18-month “Save Our Weekend” campaign, knocking on tens of thousands of doors in marginal seats before the election was even called.  Opinion polls showed strong support for retaining (or even increasing) weekend penalty rates; respondents opposed cutting penalties by two-to-one margins, or more.  The swing against the Coalition in ridings targeted by the penalty rates campaign was nearly twice as large (6 percentage points) as the national swing.

    Penalty rates will remain a charged issue in the political arena.  But for now, the main attention shifts to the FWC, whose decision is expected in coming weeks.  The Commission should reject the entreaties of retail and restaurant employers for lower penalties, because the economic case for cutting penalties looks shakier all the time.

    Employers in all sectors routinely claim that cutting wages will strengthen job-creation.  But this purported trade-off between compensation and employment is refuted by macroeconomic evidence.  Indeed, historical data suggest higher wages are more often associated with stronger employment outcomes, not weaker: in part because household consumption spending (which depends directly on wages) is crucial for overall spending power and hence economic vitality.  The retail and hospitality industries have been the most aggressive advocates of weaker penalty rates.  Yet ironically, it is in these sectors that the argument for wage-cutting is weakest of all.

    After all, employment in stores and restaurants depends directly on the level of consumer spending.  And this demand constraint is more binding in domestic service sectors than any other part of the economy.  In export-oriented industries, employers can at least pretend that lower labour costs will boost sales (by undercutting foreign competition and hence winning new business).  Even here the argument is not convincing, since in practice global competitiveness depends more on productivity, quality, and innovation than on low wages.  But in non-traded domestic sectors, where Australians produce services for other Australians, the logic falls apart completely.

    Remember, Australian consumers already spend far more than they earn.  That’s why average consumer debt is growing rapidly: now equal to 125 percent of national GDP.  How could making it less costly for shops and cafes to open on weekends, somehow unleash new reservoirs of spending power, and stimulate tens of thousands of new jobs?  In macroeconomic terms it’s simply not possible.

    Keeping businesses open for longer hours on weekends, doesn’t mean consumers have more money in their wallets.  Instead, the same amount of retail and hospitality spending must now be spread across longer opening hours.  If anything, that hurts productivity and profitability, and will eventually lead to the closure of some retail and hospitality firms that were already operating on the financial edge.

    It’s the same reason why opening a new shopping mall cannot, on its own, increase total employment levels.  Unless there are other factors driving an expansion in broader incomes and spending, opening one store must inevitably lead to a closure somewhere else.

    It’s especially laughable to hope that cheaper weekend labour could somehow attract new business to Australia’s stores and cafes.  Are penalty rate opponents expecting a surge in tourists from China, perhaps – who were just waiting for cheaper Sunday shopping before booking their trips?

    In short, the very industries pushing hardest for reduced penalties – retail and hospitality – are the ones most dependent on the spending power of domestic consumers.  Hence they would directly experience the most economic blowback from their own wage cuts.

    Indeed, there is abundant evidence that unprecedented stagnation in wages is already undermining growth and job creation.  Nominal wages are inching along at their slowest pace in recorded history (barely 1 percent per year).  Real wages, adjusted for inflation, have been falling since 2013.  Economists of all persuasions have highlighted the resulting weakness in household incomes as a key factor behind sluggish growth, rising personal debt, and unemployment and underemployment.

    Ultimately, rolling back penalties would simply constitute a major effective wage cut for workers who are already among the worst-paid in society.  It will exacerbate the broader wage stagnation that is holding back Australian growth.  And it will whet the appetites of other employers for more wage suppression – now on grounds of “keeping up” with the advantages granted to retail and hospitality.

    Australia needs higher wages, not lower.  Let’s hope the Fair Work Commission sees this big picture.


    You might also like

    Centre For Future Work to evolve into standalone entity

    The Centre for Future Work was established by the Australia Institute in 2016 to conduct and publish progressive economic research on work, employment, and labour markets. Supported by the Australian Union movement, the centre produced cutting edge research and led the national conversation on economic issues facing working people: including the future of jobs, wages

  • Looking for “Jobs and Growth”: Six Infographics

    Looking for “Jobs and Growth”: Six Infographics

    Share

    We have prepared six shareable infographics based on material in our research paper, “Jobs and Growth… and a Few Hard Numbers,” which compared Australia’s economic performance under the respective postwar Prime Ministers.

    The infographics summarize several of the specific economic variables considered in the full report, dating back to 1950 (and Prime Minister Menzies) in most cases.

    Average Annual Growth, Real Wages
    Average Employment Rate
    Growth in Personal Debt
    Average Annual Growth, Business Investment
    Public Sector Investment
    4 Signs of Turbulence Ahead

    Related research

    You might also like

    Dutton’s nuclear push will cost renewable jobs

    by Charlie Joyce

    Dutton’s nuclear push will cost renewable jobs As Australia’s federal election campaign has finally begun, opposition leader Peter Dutton’s proposal to spend hundreds of billions in public money to build seven nuclear power plants across the country has been carefully scrutinized. The technological unfeasibility, staggering cost, and scant detail of the Coalition’s nuclear proposal have

    Centre For Future Work to evolve into standalone entity

    The Centre for Future Work was established by the Australia Institute in 2016 to conduct and publish progressive economic research on work, employment, and labour markets. Supported by the Australian Union movement, the centre produced cutting edge research and led the national conversation on economic issues facing working people: including the future of jobs, wages

  • Jobs and Growth… and a Few Hard Numbers

    Jobs and Growth… and a Few Hard Numbers

    by Jim Stanford

    Share

    Voters typically rank economic issues among their top concerns. And campaigning politicians regularly make bold (but vague) pronouncements regarding their competence and credibility as “economic managers.”  In popular discourse, economic “competence” is commonly equated with being “business-friendly.”

    However, the economy consists of more than just private businesses – and certainly more than the large businesses which attract the main attention from politicians and reporters.  Other stakeholders are at least as crucial for powering real economic progress: including workers, households, governments at all levels, small businesses, public and non-profit institutions, NGOs and the voluntary sector, and more.  So being “business-friendly” is no guarantee that the real economy (measured by employment, output, and incomes) will automatically improve.  Having a more complete understanding of all of the different ingredients required for economic progress is necessary, in order to properly analyze the likely impact of specific measures.

    To demonstrate the lack of correlation between a government’s stated economic orientation, and the actual performance of the real economy, this briefing paper compiles historical data on twelve standard indicators of economic performance: including employment, unemployment, real output, investment (of various forms), foreign trade, incomes, and debt burdens.  Consistent annual data is gathered going back to the 1950s, allowing for a statistical comparison of Australia’s economic record under the various post-war Prime Ministers.  We compare Australia’s economic performance under each Prime Minister, on the basis of these twelve selected indicators.

    There is no obvious correlation between these respective swings in Australia’s economic history, and the policy orientation of the government that oversaw them. And the statistical review indicates that the present government, regardless of its business-friendly credentials, has in fact presided over one of the weakest economic periods in Australia’s entire postwar history.


    Related research

    You might also like

    Dutton’s nuclear push will cost renewable jobs

    by Charlie Joyce

    Dutton’s nuclear push will cost renewable jobs As Australia’s federal election campaign has finally begun, opposition leader Peter Dutton’s proposal to spend hundreds of billions in public money to build seven nuclear power plants across the country has been carefully scrutinized. The technological unfeasibility, staggering cost, and scant detail of the Coalition’s nuclear proposal have

  • Bracket Creep Is A Phoney Menace

    Originally published in New Matilda on May 11, 2016

    For someone who piously bemoans an “us versus them” mentality in political culture, Treasurer Scott Morrison certainly drove a deep wedge into the social fabric with one of the centrepieces of his budget. There are four thresholds in the personal income tax system; Morrison chose to increase one of them, supposedly to offset the insidious effects of “bracket creep.” The third threshold will be raised from $80,000 to $87,000.

    Other thresholds don’t change. Taxpayers making over $80,000 will thus get a small saving ($6 per week at most). Those who make less, get nothing.

    It’s not the most expensive tax cut in the budget. It will cost an estimated $800 million in the first year – barely half the $1.5 billion lost annually by cancelling the deficit repair levy on incomes over $180,000, and far less than the ultimate cost of Morrison’s company tax cuts. But it is the most transparent and easy to understand of all the budget’s tax measures. And it will spark the most gossip around the water-cooler. Who makes over $80,000 per year, anyway? And who makes less? It’s hard to imagine a more “us versus them” tax policy.

    The Treasurer’s own rhetoric reinforces this schism: he says it will “reward hard working Australians,” encourage them to work overtime, take more shifts, and accept a promotion. The clear implication is that people making less than $80,000 are not interested in working more hours or taking promotions. Indeed, they aren’t even “hard working” in the Treasurer’s terms, and hence don’t merit protection from “creeping” taxes.

    The Treasurer tried, but failed, to define the measure as one that benefits “average” wage-earners. Mean annual earnings for a full-time worker employed year-round are indeed near $80,000. But this does not remotely describe the typical Australian. First off, the mathematical “average” is skewed upward by super-high incomes at the top of the income ladder; the median full-time wage (received by the full-time worker in the exact middle of the distribution) is $10,000 lower than the average, and well below the threshold. Likewise, women (even those employed full-time year-round) earn $10,000 less than the mathematical mean.

    Federal Treasurer Scott Morrison delivering his first budget, in 2016.
    Federal Treasurer Scott Morrison delivering his first budget, in 2016.

    But the bigger problem is that a shrinking share of Australians have full-time permanent jobs to start with. Part-time work now accounts for almost one in three jobs – the highest on record.  And labour hire, temporary contract, and other forms of precarious work are increasingly the norm. Very few of those workers earn anywhere near $80,000. At most about one in four Australian workers (and perhaps 15 per cent of all tax-filers) will get the full $6 per week saving.

    The whole concept of “bracket creep” is itself as misleading as Morrison’s maths. He says taxpayers are “pushed” into higher tax brackets by rising incomes, constituting a punitive and underhanded tax grab. But this description merits some careful second thought.

    There are two different reasons why a worker’s income might rise. One is pure inflation, experienced across all wages and prices. In that case, nothing “real” changes, and a higher tax rate might seem unfair (although we should remember that the cost of many government programs also grows with inflation, and someone has to pay for that).

    Alternatively, it might be changes in a worker’s real income that qualify them for the next bracket. If they worked more hours or took a promotion (as the Treasurer urges), then their real income rises, and so does their tax. That’s not bracket creep, and there’s nothing “underhanded” about it. In fact, that is the whole point of a personal income tax system in which tax rates depend on income.

    Moral panic over bracket creep is all the more ironic given the unprecedented stagnation in Australian wages, reflecting sustained weakness in the job market. Average weekly earnings in the private sector are growing at their slowest pace in history: under 1 per cent per year (slower than inflation). The budget itself acknowledged this is badly hurting Commonwealth revenues. With wages going nowhere fast, this is hardly the time in history to make a mountain out of a bracket creep molehill.

    If the government truly wanted to prevent inflation from distorting taxes, it could simply index all parameters in the tax code to consumer prices (as other countries, like the U.S. and Canada, have done). Then all thresholds, not just the one cherry-picked by Morrison, would rise 1.3 per cent this year, the same as year-over-year inflation. But that would depoliticise the whole process, hardly acceptable in a year when every single clause of the budget is focused on getting the government re-elected. So Morrison picked one politically-potent threshold, lifted it seven times faster than inflation, and left everyone else to get “creeped.”

    Previous ad-hoc increases to thresholds have lifted them far faster than inflation. In fact, with this latest increase, the third tax threshold will have risen twice as much as inflation since 2003. Combined with rate reductions also targeted at top brackets during that time, government revenues have been undermined badly, and the upward redistribution of after-tax income has been exacerbated.

    In short, the politics of Morrison’s over/under game are hard to understand. He will deliver a tiny benefit to less than one in four employed workers, and barely one in seven tax-filers. Most Australians won’t get a cent. But the economics are even worse. His divisive and false anti-tax narrative undermines the long-run stability of the government’s revenue base, damages public services, and reinforces inequality.


    You might also like

    Commonwealth Budget 2025-2026: Our analysis

    by Fiona Macdonald

    The Centre for Future Work’s research team has analysed the Commonwealth Government’s budget, focusing on key areas for workers, working lives, and labour markets. As expected with a Federal election looming, the budget is not a horror one of austerity. However, the 2025-2026 budget is characterised by the absence of any significant initiatives. There is

    Centre For Future Work to evolve into standalone entity

    The Centre for Future Work was established by the Australia Institute in 2016 to conduct and publish progressive economic research on work, employment, and labour markets. Supported by the Australian Union movement, the centre produced cutting edge research and led the national conversation on economic issues facing working people: including the future of jobs, wages

  • 6 Reasons to Be Skeptical of Debt-Phobia

    6 Reasons to Be Skeptical of Debt-Phobia

    by Jim Stanford

    In the lead-up to tomorrow’s pre-election Commonwealth budget, much has been written about the need to quickly eliminate the government’s deficit, and reduce its accumulated debt.  The standard shibboleths are being liberally invoked: government must face hard truths and learn to live within its means; government must balance its budget (just like households do); debt-raters will punish us for our profligacy; and more.  Pumping up fear of government debt is always an essential step in preparing the public to accept cutbacks in essential public services.   And with Australians heading to the polls, the tough-love imagery serves another function: instilling fear that a change in government, at such a fragile time, would threaten the “stability” of Australia’s economy.

    However, this well-worn line of rhetoric will fit uncomfortably for the Coalition government, given its indecisive and contradictory approach to fiscal policy while in office.  The deficit has gotten bigger, not smaller, on their watch, despite the destructive and unnecessary cutbacks in public services imposed in their first budget.  Their response to Australia’s fiscal and economic problems has consisted mostly of floating one half-formed trial balloon after another (from raising the GST to transferring income tax powers to the states to cutting corporate taxes), with no systematic analysis or framework.  And their ideological desire to invoke a phony debt “crisis” as an excuse for ratcheting down spending will conflict with another, more immediate priority: throwing around new money (or at least announcements of new money), especially in marginal electorates, in hopes of buying their way back into office.

    In short, the politics of debt and deficits will be both intense and complicated in the coming weeks.  To help inoculate Australians against this hysteria, here are six important facts about public debt, what it is – and what it isn’t.

    1. Australia’s public debt is relatively small

    Despite annual deficits incurred since the GFC, Australia’s accumulated government debt is still small by international standards.  Debt can be measured on a gross or net basis; gross debt counts total outstanding borrowing, while net debt deducts the value of financial assets which the government also possesses.  Gross debt for all levels of government equaled 44% of Australian GDP at the end of 2015 (according to the OECD).  That was the 5th lowest indebtedness of any of the 34 OECD countries (see table below), equal to about one-third the average level experienced across the OECD.  Moreover, despite recent deficits, the growth of debt in Australia was considerably slower than in most other OECD countries.  Of course, having low debt in and of itself does not justify increasing it.  But given the universal fiscal challenges that have faced industrial countries since the GFC, Australia’s debt challenge is both unsurprising and relatively mild.

    Australia’s Debt in International Context: General Government (all levels) Gross Financial Liabilities (%GDP) 
    2015 10-yr. Change
    Australia 44.2% +22.4 pts
    U.S. 110.6% +43.7 pts
    Japan 229.2% +59.7 pts
    France 120.1% +38.3 pts
    Germany 78.5% +8.1 pts
    Italy 160.7% +41.8 pts
    U.K. 116.4% +60.3 pts
    Canada 94.8% +19.0 pts
    OECD Average 115.2% +36.3 pts
    Source: Author’s calculations from OECD Economic Outlook #98, Nov.2015.

    2. A government debt is matched by an asset

    Australians aren’t “poorer” because their government accumulates a debt.  Any rise in government debt is mirrored by an increase in some offsetting asset.  This is true in both accounting terms, and in real economic terms.  For example, government typically issues a bond (or some other financial instrument) to finance a deficit.  But that bond also constitutes an asset in the investment portfolio of whoever lent the government money.  Most Australian government debt is owned by Australians.  In fact, investors increasingly appreciate the opportunity to invest in government bonds, because they are safer than other assets at a time of financial uncertainty.  (That investor interest is one reason interest rates on government debt are so low.)  So government debt translates into someone else’s wealth – usually someone in Australia.

    This match between liabilities and assets is also visible in concrete economic terms – especially when new debt is issued to construct a real, long-lasting capital asset (like a road, a transit system, a school, or a hospital).  In this case, the matching asset is owned by government itself, and so its own net worth won’t change much at all: it takes on a new debt, but also has a new asset.  For budgetary purposes, the government must account for the gradual wear-and-tear of that asset (called depreciation), which appears as a cost item on the budget.  But it hasn’t “lost” the money it raised through the new debt: it invested it, and that investment carries both financial and social value.

    3. Other sectors of society borrow much more than government

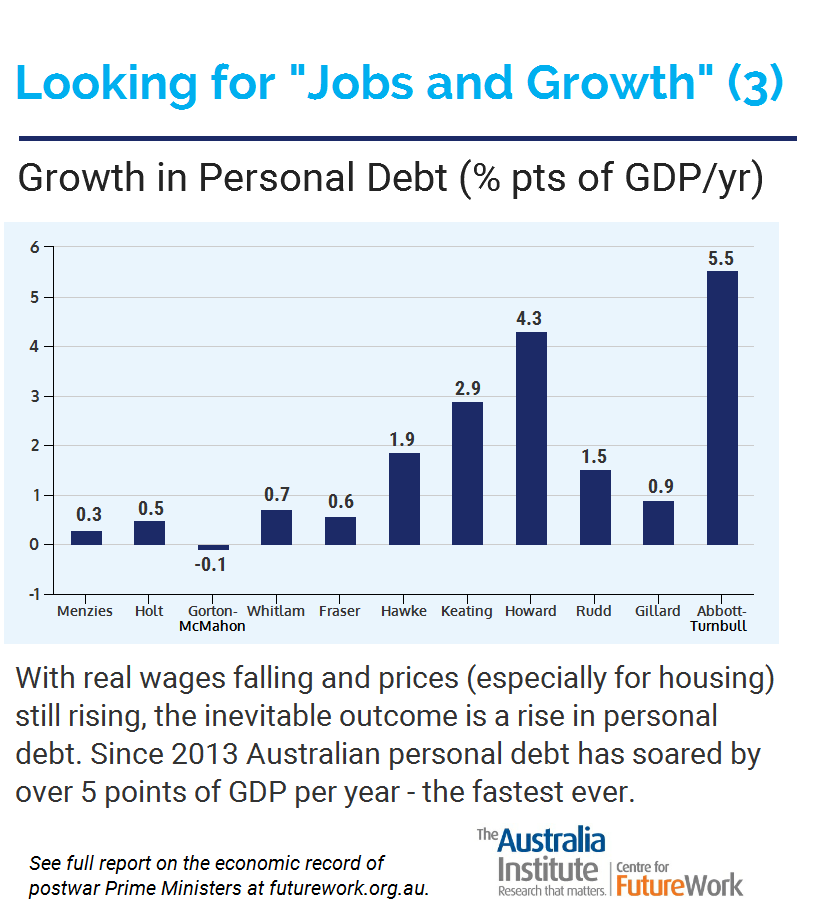
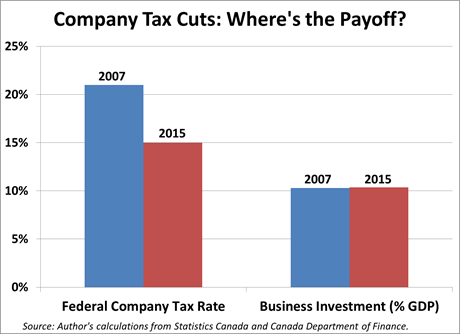
    Tired rhetoric about how governments need to act “more like households” is especially ironic, given that households are by far the most indebted sector in Australian society.  Household net debts equal close to 125% of GDP – or around 4 times the net debt of government (all levels), according to data from the Bank for International Settlements.  It is factually wrong to claim that “households balance their budgets,” and therefore governments must do the same.  Households borrow regularly – and thanks to overinflated housing prices and stagnant wages, that borrowing is growing rapidly.  The same is true of business: net debts of non-financial corporations are more than twice the net debt of government (see chart).

    In fact, it is quite rational for households and businesses to borrow, when needed to fund purchase of long-run productive assets (like a house or a car for consumers, or a factory or new technology for a business).  Business leaders know that rational, prudent borrowing will enhance the profitability of a corporation.  Indeed, any CEO who said paying off all company debt was the top priority of the firm would be chased from office by directors and shareholders (who would understand the pledge was irrational and superstitious).  Following exactly the same logic, government debt can be rational and productive – especially (but not only) when it is associated with the acquisition of long-run productive assets (like infrastructure).  Close to two-thirds of the Commonwealth government’s 2015/16 deficit (projected to be $36 billion) is associated with capital spending, including $11 billion in capital transfers to lower levels of government and $12 billion in net investment in Commonwealth non-financial assets.  Contrary to the rhetoric, Australians do largely cover the cost of current public services with their current tax payments.  Government borrowing is primarily required to fund capital spending.

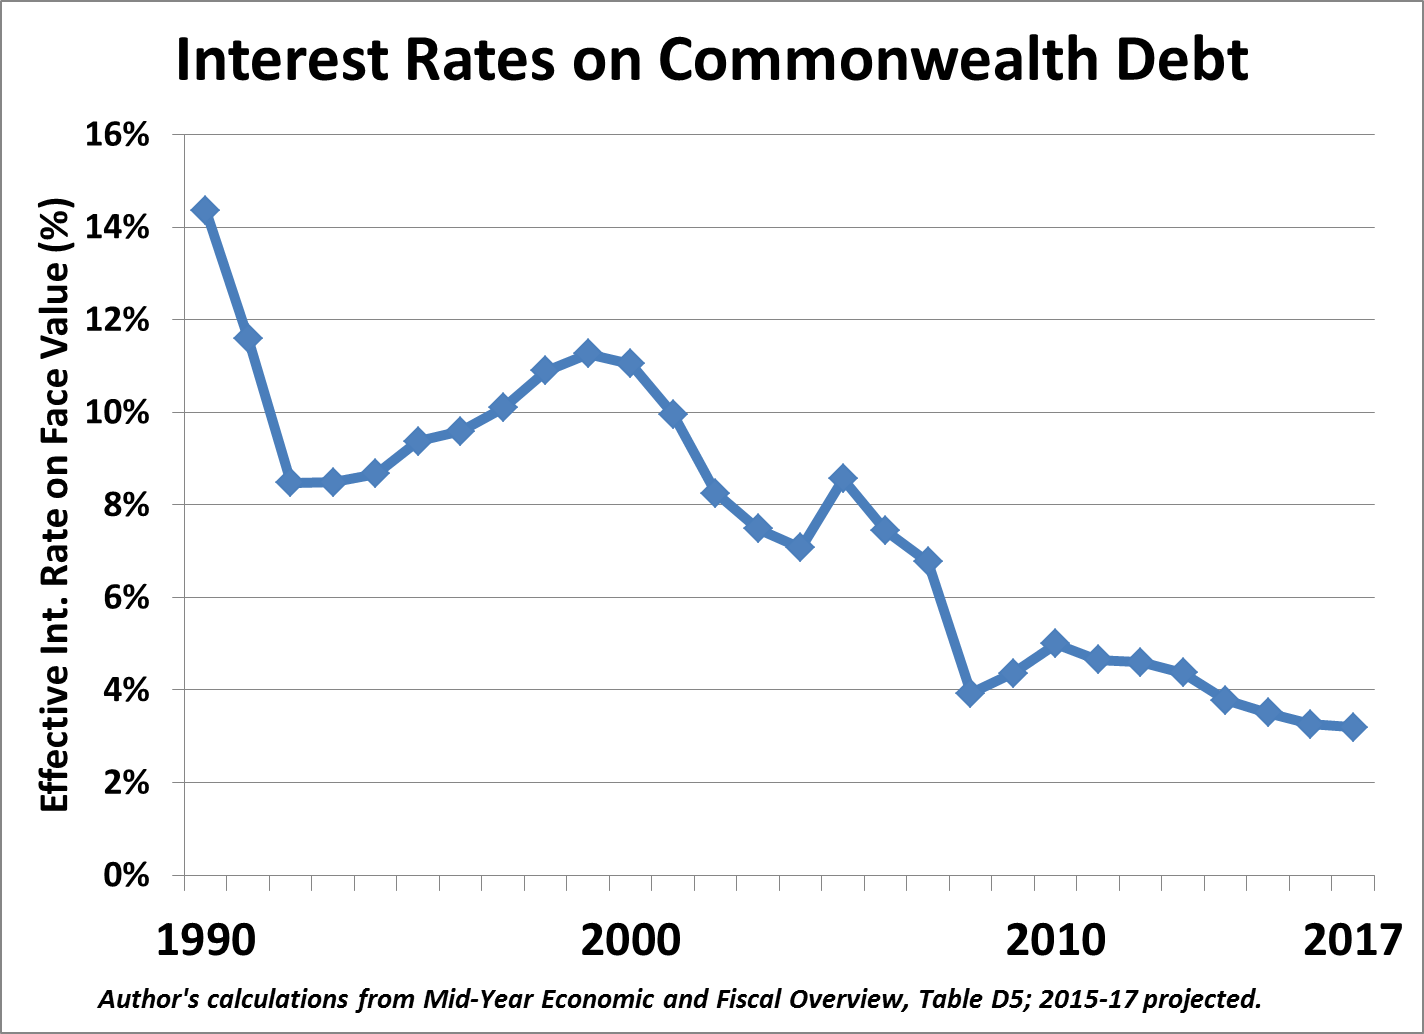
    4. Interest rates are low, and falling

    The cost of public borrowing has fallen dramatically as a result of the decline in Australian and global interest rates since the GFC (see chart).  Indeed, the two factors are connected: large government deficits resulted primarily from underlying economic weakness (this is true in Australia, like elsewhere in the industrialized world), which in turn bro8ught about low interest rates (via both central banks and private financial markets).  These very low interest rates mean that the cost-benefit decision associated with any new government borrowing has been fundamentally altered, in favour of borrowing.

    Current interest rates are likely to stay low for many years to come, given the continuing failure of the global economy to regain consistent momentum, the slowdown in China, and other factors.  (In fact, it is possible that the Reserve Bank of Australia may soon cut its interest rate further, below its current record-low 2% level, due to weak growth and signs of deflation here in Australia.)  Ten-year Commonwealth bonds can presently be floated to private investors for little more than 2% interest (close to zero in real after-inflation terms).  If government can borrow for what is effectively zero interest, and put that money to work in the real economy doing useful things (including both infrastructure and public services), then it is irrational to let old-fashioned balanced-budget mythology stand in the way.

    Even if current interest rates do not fall any further, the average effective interest rate paid on overall public debt will continue to fall for years to come.  The current average effective rate paid on Commonwealth debt (about 3.5% last year) reflects the weighted average paid on all maturities of debt.  As past debts come due, they are refinanced at now-much-lower interest rates (those prevailing on new issues of bonds).  That will pull down the average weighted interest rate for several years into the future – even if the rate on new issues stabilizes or increases somewhat.  Consider that new ten-year bonds can be issued for less than half the interest rate paid a decade ago.  The refinancing of those bonds will generate enormous future interest savings for government (equivalent to home-owners who re-mortgage their homes to benefit from the decline in household lending rates).

    This is why the economic burden of public debt servicing is not growing, even though the debt is.  Government budget projections forecast debt service remaining at between 0.9 and 1.0% of GDP for the next 5 years, with the effect of rising debt offset by falling interest rates.  And those government projections likely overestimate true interest costs (partly for political reasons).  For example, the December 2015 MYEFO update assumes a significant increase in interest rates in the coming year (its near-term interest rate assumption was 0.3 points higher than the assumption used in last year’s budget); ongoing global and domestic economic weakness makes that highly unlikely.

    5. The debt/GDP ratio is a more meaningful fiscal constraint than a balanced budget

    Fear-mongers think that by talking about public debt in “big numbers,” the fright value of their dire forecasts can be magnified accordingly.  But all macroeconomic aggregates are measured in big numbers.  And what’s more important than the absolute size of debt, is the government’s capacity to service that debt.  That, in turn, depends on the flow of government revenues, which in turn is driven primarily by overall economic growth.  That’s why economists prefer to evaluate public debt relative to GDP (called the “debt ratio”).  Even this ratio can overstate the real burden of debt, in times (like now) when interest rates are low and falling.

    Avoiding a lasting, uncontrolled rise in the debt/GDP ratio is a more meaningful fiscal constraint on government, than trying to balance a budget in any particular year.  Economists do not agree on a maximum “acceptable” limit for that ratio.  But most agree it cannot rise forever.  (Some economists argue that there is no limit on a government’s ability to issue sovereign debt denominated in its own currency, and the recent experience of countries like Japan – whose debt ratio is five times Australia’s – is consistent with that view.)

    At any rate, Australia is far away from any feasible “ceiling” on public debt relative to GDP.  And remember, like any ratio, the debt/GDP ratio has both a numerator and denominator: growing the denominator is as effective as shrinking the numerator, if the goal is reducing the value of the combined ratio.  In this regard, the stagnation in Australia’s nominal GDP in recent years has been more damaging to the trajectory of the debt ratio, as has the addition of debt through continued deficits.  The government’s policy focus should be on expanding economic activity (and the jobs and incomes that go with it), rather than suppressing the deficit with austerity measures (which have the unintended consequence of undermining growth and hence the economy’s ability to service a given amount of debt).

    6. The government can incur moderate deficits every year, yet still stabilize its debt burden

    A related and under-appreciated countervailing argument is to note that government can run a medium-sized deficit on an ongoing basis, and yet experience no increase in the debt/GDP ratio at all – so long as the economy is progressing at a normal pace.  A deficit adds to the numerator of the ratio, while economic growth expands the denominator.  So long as both are expanding at roughly the same rate, the ratio will not be changed.  (Our reference to economic expansion envisions more jobs and incomes across the economy, including in the public sector, and with due attention to the need for environmental sustainability.)  This basic arithmetic provides government with an additional degree of maneuverability in financing essential services and investments, without unduly increasing the debt ratio.

    A simple numerical example helps to illustrate the point in Australia’s context.  A healthy economy should be expanding by at least 5-6 percent per year in nominal terms: divided roughly equally between inflation (given the RBA’s 2-3 percent inflation target) and greater output of real goods and services (driven by both population and productivity).  The Commonwealth’s current net debt ratio is slightly below 20 percent of GDP.  With a healthy economic expansion, the government could incur an annual deficit of 1-1.25 percent of GDP (or close to $20 billion per year) but still stabilize the debt ratio below that 20 percent benchmark.  And there is nothing magical about a 20% debt ratio; if Australians were willing to tolerate a larger steady-state debt ratio, then the size of this annual permissible deficit would be correspondingly higher.  All this merely reinforces the need for government to focus on supporting job-creation and incomes, not balancing its budget – and confirms that ample fiscal space is indeed available for the Commonwealth to fund public services and infrastructure spending (with the fringe benefit of reinforcing strong job creation that should be their top priority).


    You might also like

    Commonwealth Budget 2025-2026: Our analysis

    by Fiona Macdonald

    The Centre for Future Work’s research team has analysed the Commonwealth Government’s budget, focusing on key areas for workers, working lives, and labour markets. As expected with a Federal election looming, the budget is not a horror one of austerity. However, the 2025-2026 budget is characterised by the absence of any significant initiatives. There is

    Centre For Future Work to evolve into standalone entity

    The Centre for Future Work was established by the Australia Institute in 2016 to conduct and publish progressive economic research on work, employment, and labour markets. Supported by the Australian Union movement, the centre produced cutting edge research and led the national conversation on economic issues facing working people: including the future of jobs, wages

  • Company Tax Cuts: A Cautionary Tale from Canada

    Originally published in New Matilda on March 3, 2016

    Was it really the Treasury’s economic modeling that convinced Prime Minister Turnbull to abandon his plan to raise the GST and cut income taxes? Treasury simulations indicated the trade-off would have no significant impact on growth. Or perhaps it was another kind of calculation – electoral – that convinced the Coalition to drop the idea, and the economic numbers just provided political cover.

    Whatever the motive, the constituency most disappointed by this about-face is the corporate sector. Business leaders hoped to ride the coat-tails of a “tax shift” to achieve a significant reduction in company income taxes. And they continue to beat the drum for lower business taxes, financed if necessary from other fiscal savings. By sweetening after-tax returns, they argue, business capital spending will accelerate: driving GDP expansion, more jobs, and fiscal dividends for government. In short, everybody wins.

    But is their promise of a growth dividend realistic?

    Never mind economic models, which depend entirely on whatever assumptions are programmed in by the modelers. Instead, let’s consider some real-world experience to judge whether company tax cuts would indeed generate a significant growth dividend. Canada’s recent experience with deep corporate income tax cuts is especially relevant to Australia, given the structural similarities between the two economies: large geography, dependence on major resource projects, and large inflows of foreign capital.

    CanadaBusinessTax

    The Canadian federal government implemented three successive federal corporate tax reductions over the last generation. (Provincial governments also levy their own corporate taxes, averaging around 10 per cent, added to federal levies.) The first stage occurred in the late 1980s: the statutory rate was reduced from 36 per cent to 28 per cent, but various loopholes and deductions were closed in the process. The second reform occurred early this century: the general rate fell to 21 per cent, and preferences for manufacturing and resources were eliminated. The latest cuts were implemented beginning in 2007 by former Conservative Prime Minister Stephen Harper (defeated in last year’s election): he cut the base rate to 15 per cent, and eliminated a 1.1 per cent CIT surtax. Those last reductions alone still cost the federal government over $15 billion (Canadian Dollars) in foregone revenue each year.

    Together, these successive cuts reduced combined Canadian corporate taxes (including provincial rates, which also fell in several provinces) from near 50 per cent of pre-tax income in the early 1980s, to 26 per cent today. In theory, the resulting boost to profits should have stimulated a strong response in business investment. Unfortunately, hopes for this “jobs and growth” dividend have been repeatedly dashed.

    Instead of growing, business spending on fixed capital (machinery, structures, etc.) declined under lower company taxes, by about one full point of GDP since the reforms began. Business innovation spending (one of Mr. Turnbull’s top priorities) fared even worse: business R&D outlays shrank by over one-third as a share of GDP, to a record low of just 0.8 per cent. In fact, over the last decade real business investment performed worse than during any other era in Canada’s postwar history. Several provincial governments have given up waiting for the promised investment boom, and are now increasing company tax rates to help address chronic deficits.

    It is instructive to compare Canada and Australia’s investment performance over this period. Both countries face the same booms and busts in global commodity prices. Yet in the last decade business spending on fixed assets grew more than twice as fast in Australia, according to OECD data: by 3.9 per cent per year in Australia (after inflation), despite higher company taxes, versus an anemic 1.7 percent in Canada. Canada’s GDP outgrew Australia’s in just two of those ten years, and last year the country slipped into outright recession.

    One especially painful side-effect of lower company taxes has been the sustained accumulation of liquid assets by Canada’s non-financial businesses. Corporate cash hoarding accelerated dramatically after the turn of the century. Non-financial firms now hold cash and other liquid assets equal to over 30 per cent of GDP. IMF researchers have shown that corporate cash holdings grew faster in Canada than any other G7 economy (and twice as fast as in Australia).

    With businesses investing less than they receive in after-tax cash flow, lower taxes only add to the stockpile of idle liquid assets, draining spending power from the economy. In this regard, lower corporate taxes may very well have weakened growth and job-creation, not strengthened it. In any event, Canada’s experience is a sobering reminder to Australian policy-makers: anyone expecting a tax shift to generate a big growth dividend is likely to face chronic disappointment.


    You might also like

    Commonwealth Budget 2025-2026: Our analysis

    by Fiona Macdonald

    The Centre for Future Work’s research team has analysed the Commonwealth Government’s budget, focusing on key areas for workers, working lives, and labour markets. As expected with a Federal election looming, the budget is not a horror one of austerity. However, the 2025-2026 budget is characterised by the absence of any significant initiatives. There is